All guides
GuidesYour books
Sales, Money and Stock
The three Insights screens card by card, how margins and days of stock are worked out, and how to add, remove and reorder the cards.
6 minute read
Three screens made of cards
Insights opens Sales. Money and Stock are beside it. Each is made of cards, and you can choose which cards each screen shows.
A small tag on a card, such as +12.3%, compares the period with the one of the same length just before. It appears only when that earlier period lies inside your books.
Sales
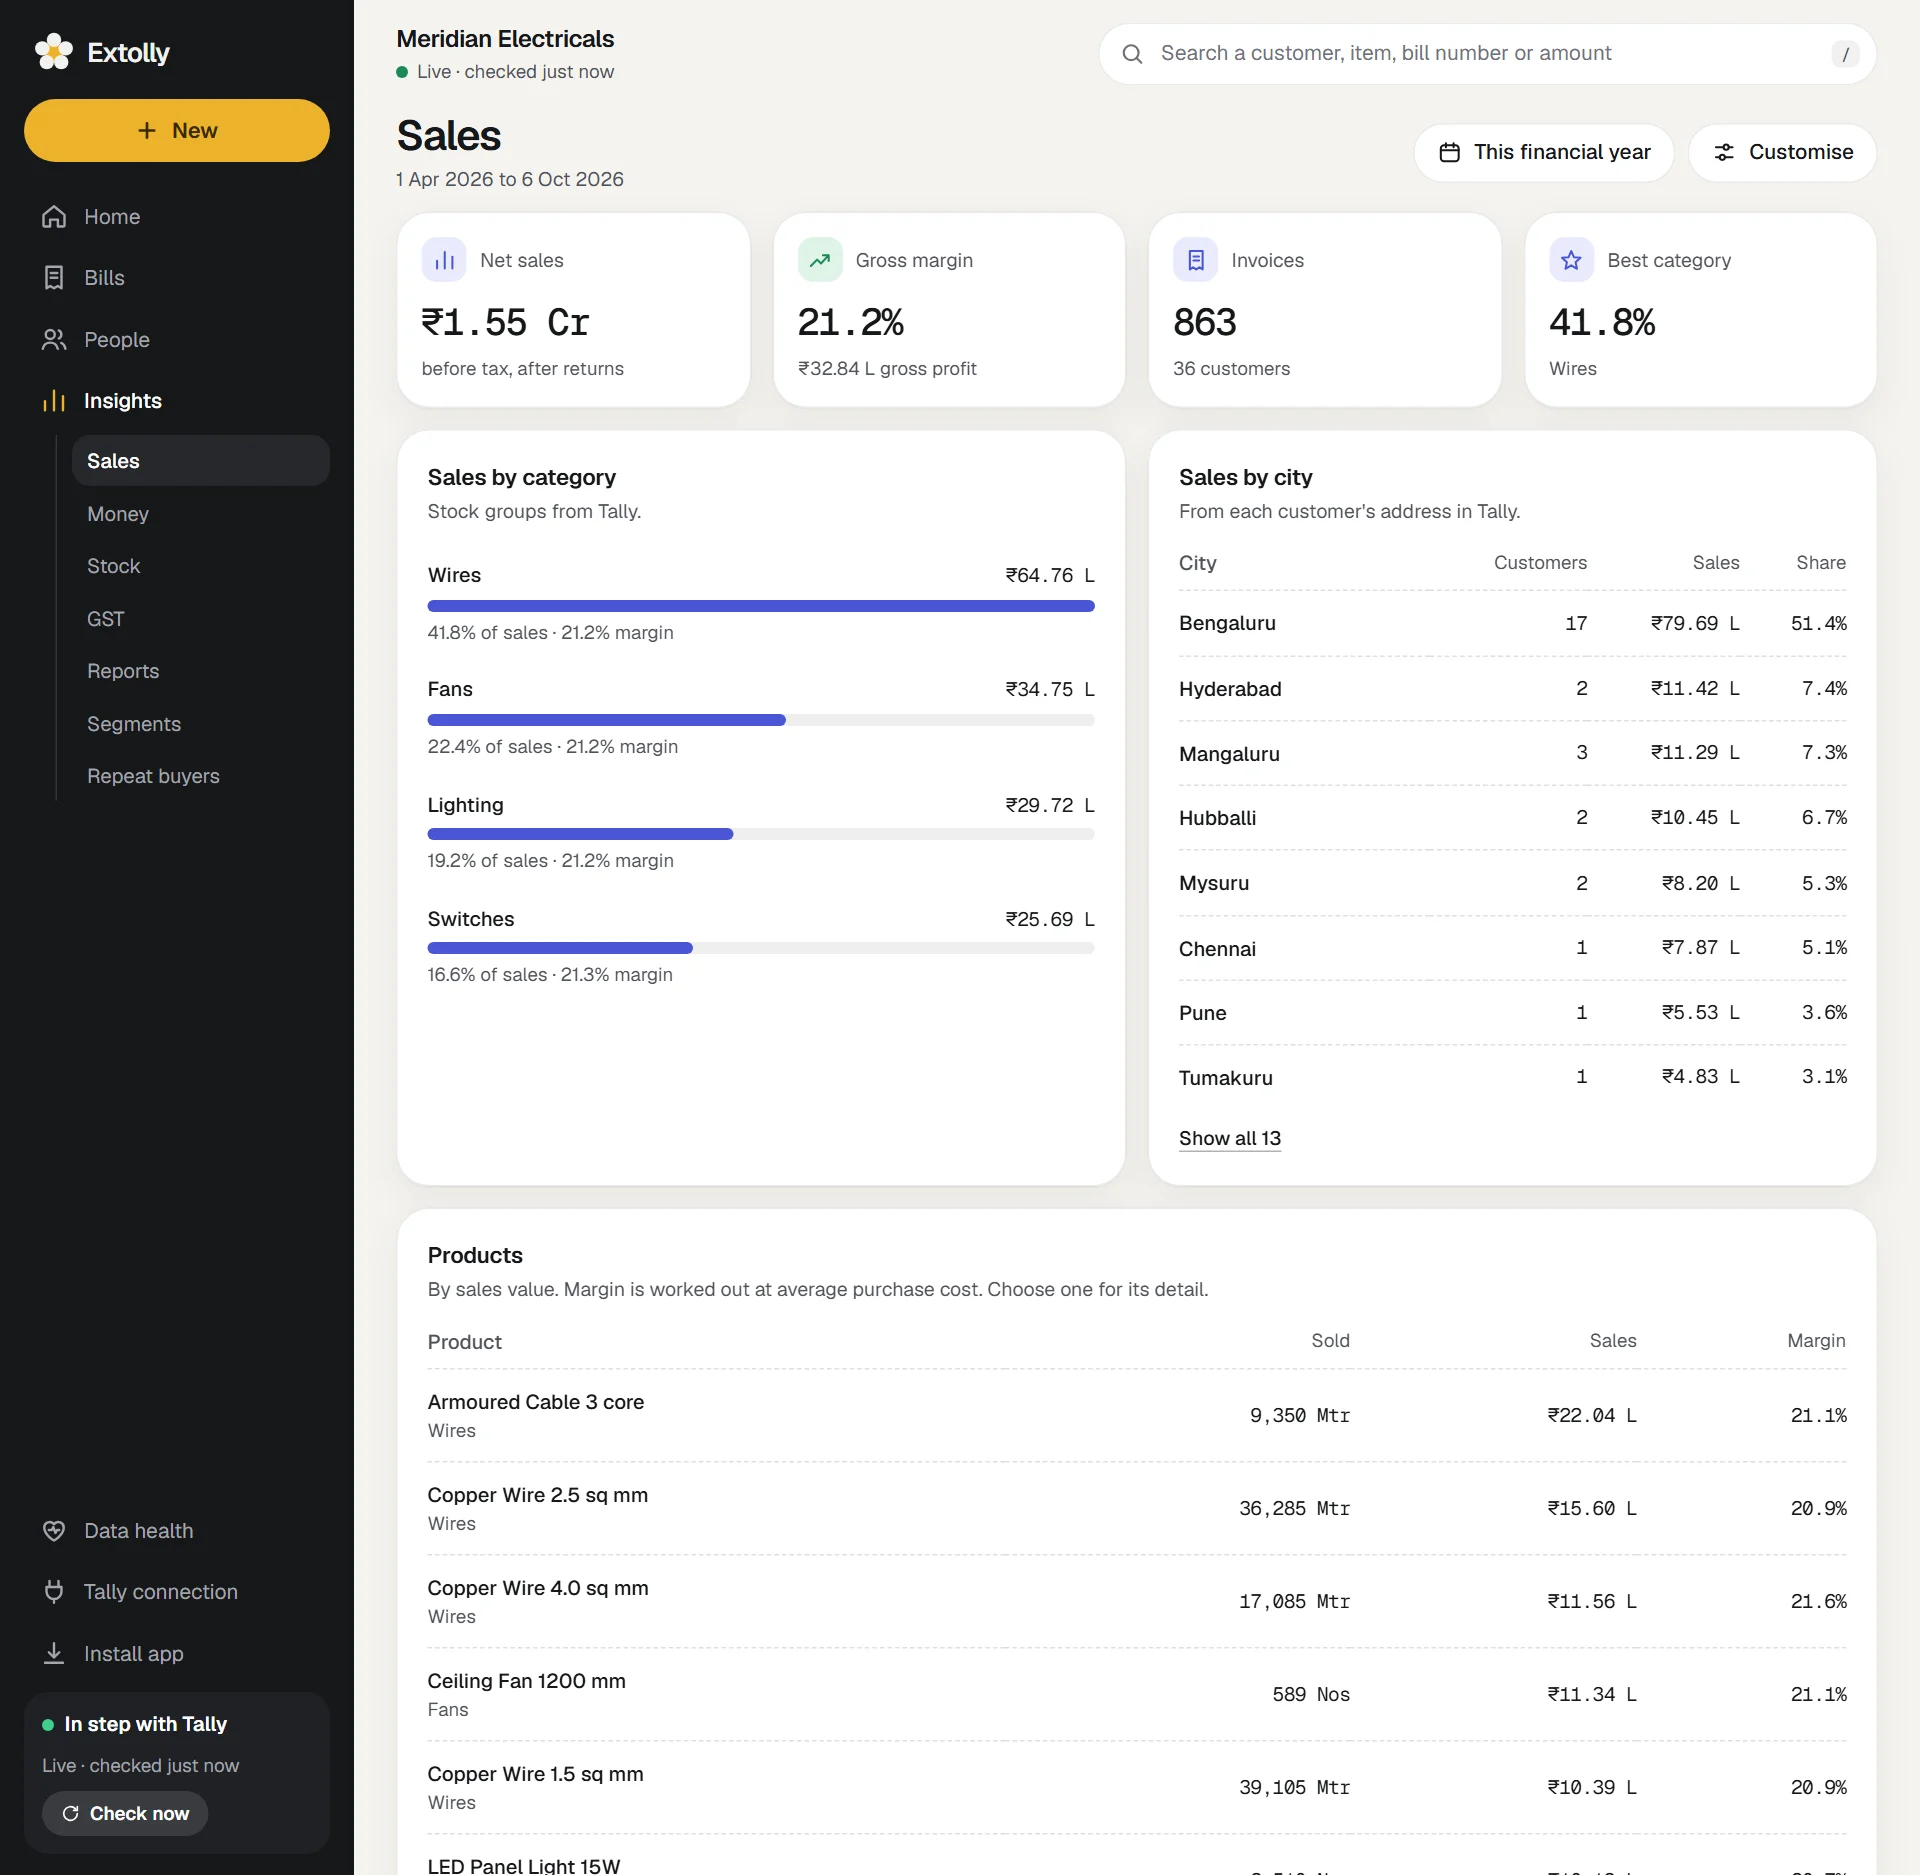
| Card | Shows |
|---|---|
| Net sales | Sales before tax, after returns |
| Gross margin | A percentage, with the gross profit in rupees |
| Invoices | How many, and to how many customers |
| Best category | The stock group with the largest share of sales |
| Sales by category | Each stock group from Tally, with its share of sales and its margin |
| Sales by city | From each customer's address in Tally. Customers with no address appear under Unknown |
| Products | Every product sold, with quantity, sales and margin. Press one for its detail |
Pressing a product opens a sheet with its sales by month, its average selling price and purchase cost, how much is in stock and where, and who buys it.
Money
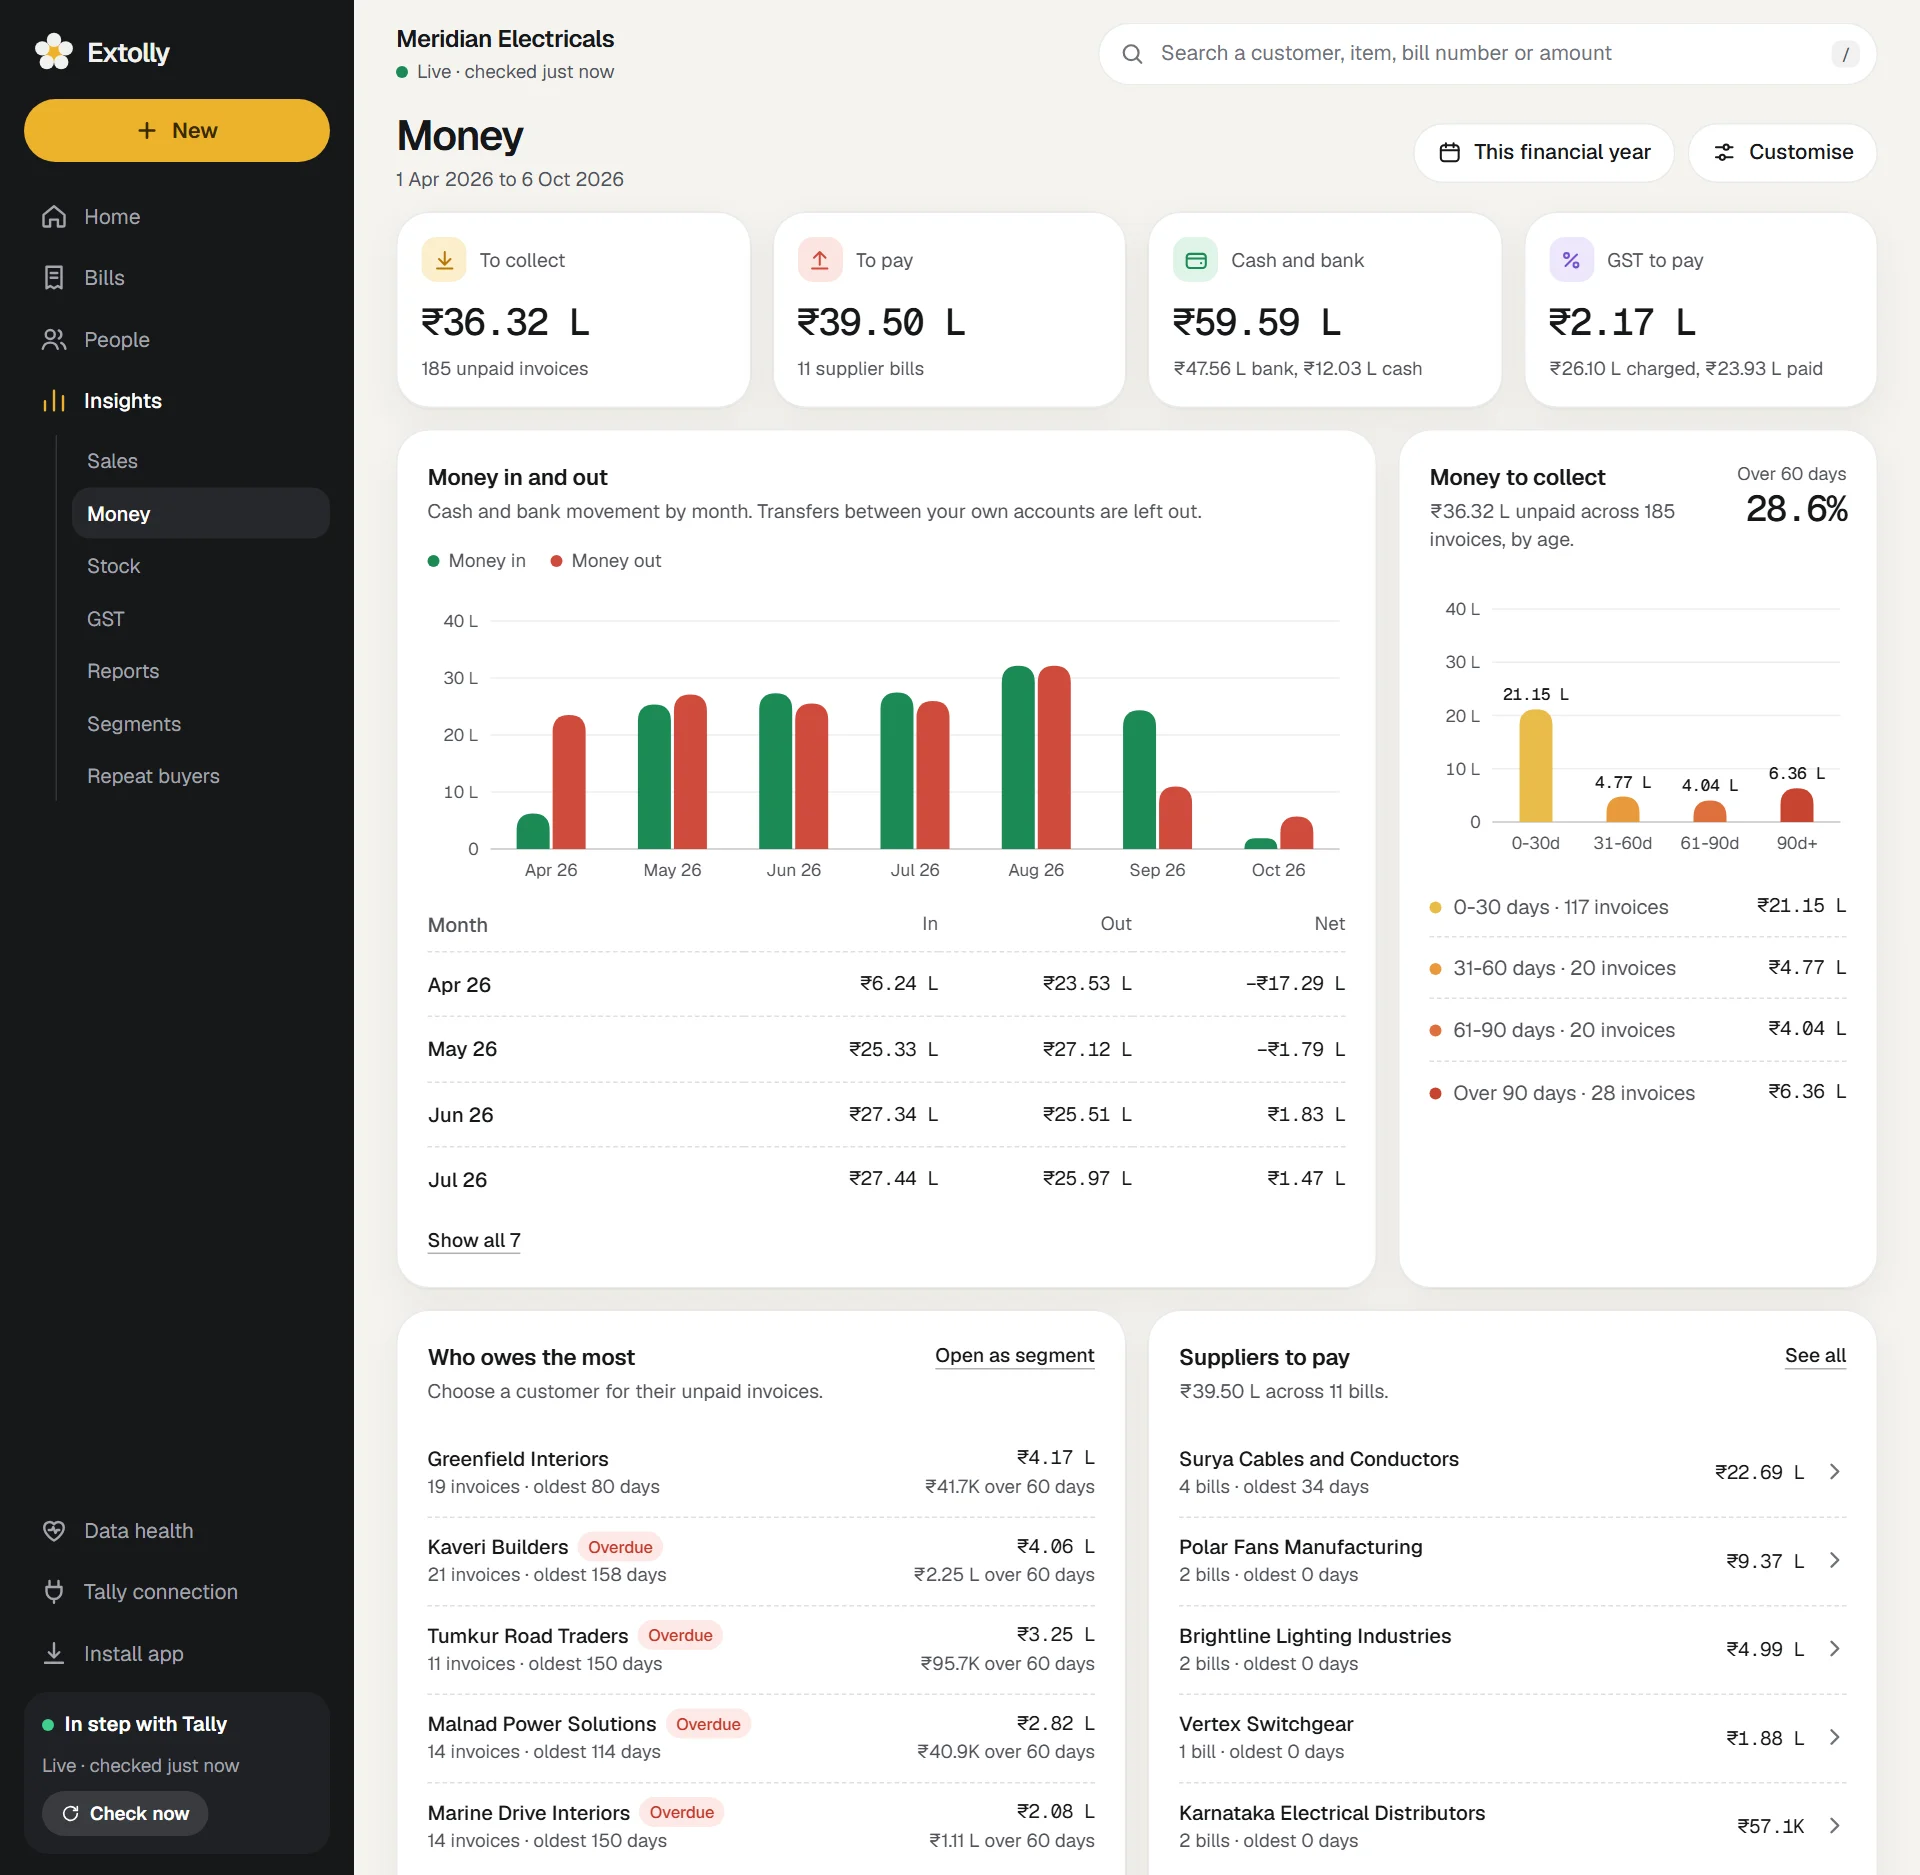
| Card | Shows |
|---|---|
| To collect, To pay, Cash and bank | As things stand today |
| GST to pay or GST credit | For the period |
| Money in and out | Cash and bank movement by month. Transfers between your own accounts are left out |
| Money to collect | Unpaid invoices by age: 0-30 days, 31-60 days, 61-90 days, Over 90 days, with the share that is over 60 days |
| Who owes the most | The customers with the most unpaid, with the age of their oldest invoice. Open as segment turns the list into a segment you can save |
| Suppliers to pay | The suppliers you owe most |
Age is counted from the day each bill fell due, not the day it was made.
Stock
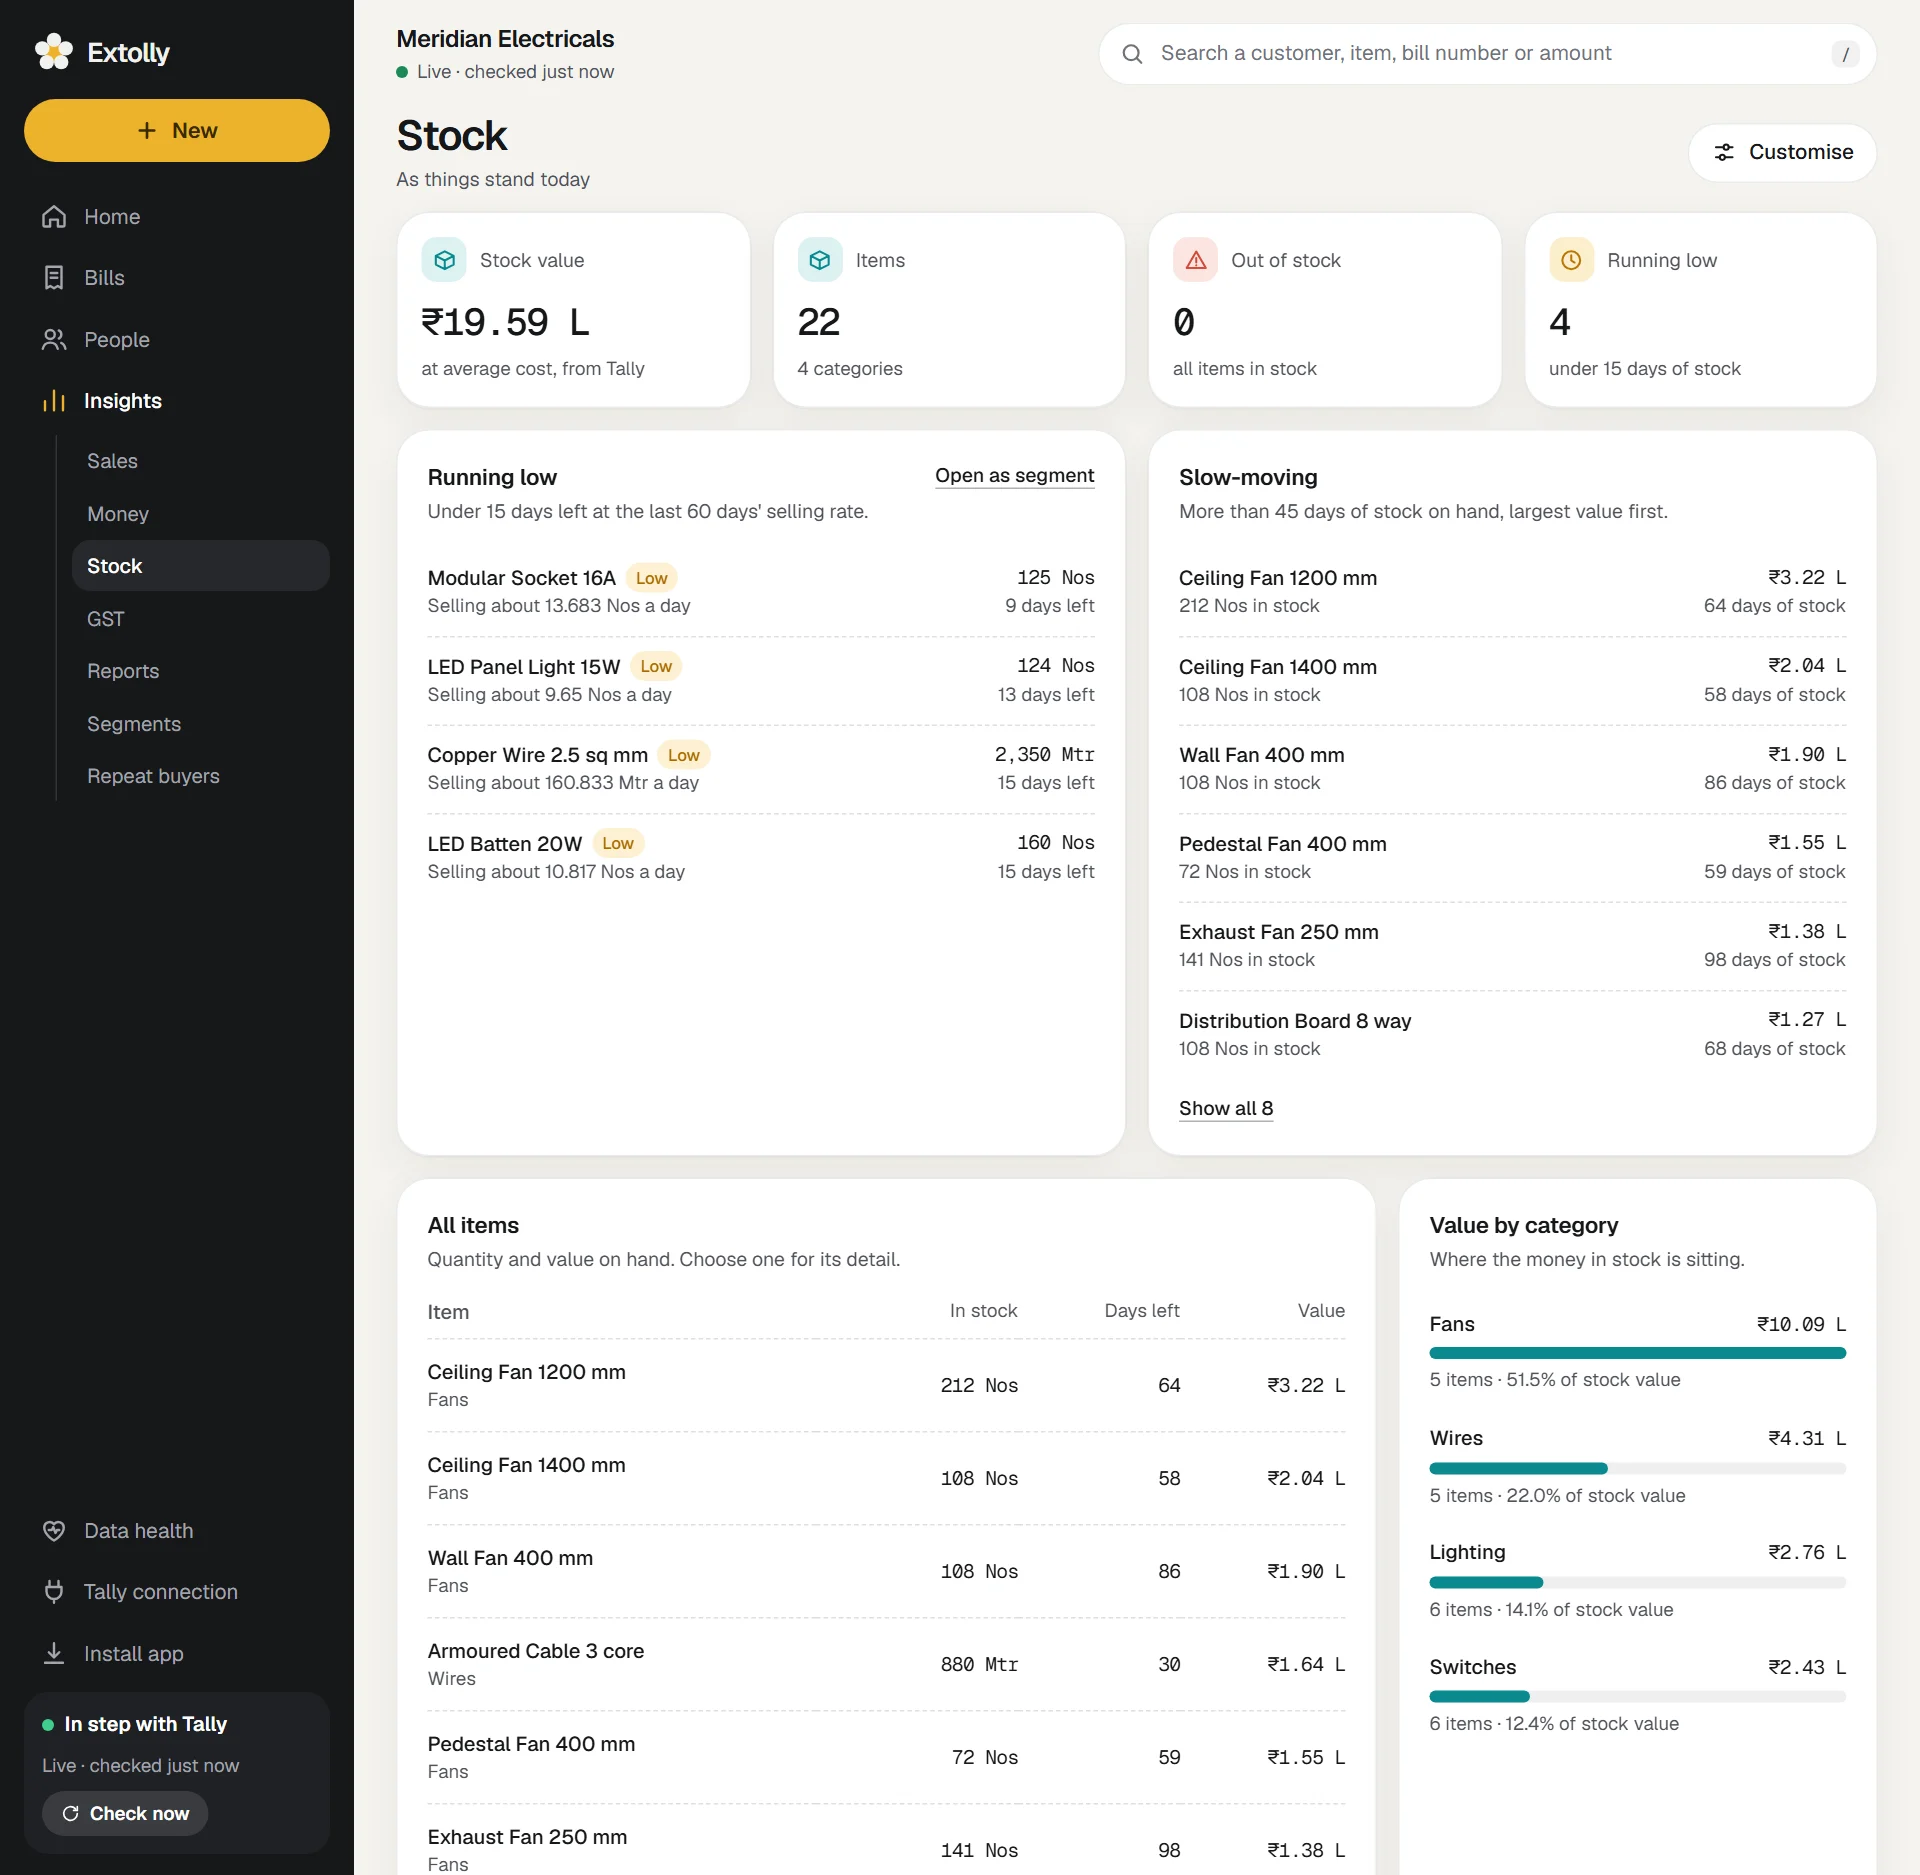
Stock is shown as it stands today, so this screen has no period picker.
| Card | Shows |
|---|---|
| Stock value | At average cost, from Tally |
| Items | How many, in how many categories |
| Out of stock | Items with nothing left |
| Running low | Items with under 15 days of stock at the rate they have been selling |
| Slow-moving | Items with more than 45 days of stock on hand, largest value first |
| All items | Quantity and value on hand, and days left, for every item |
| Value by category | Where the money in stock is sitting |
How the figures are worked out
- Margin and stock value use average purchase cost. If your company values stock another way in Tally, such as first in first out, Extolly's stock value can differ from Tally's. Data health compares the two and shows both figures.
- An item with no purchase cost in Tally shows a margin of 100%, because Tally has no cost for it. Data health lists these.
- The selling rate behind "days of stock" is the last 60 days of sales, or as many days as your books hold.
- Running low means under 15 days of stock. Slow-moving means over 45 days. Gone quiet, for customers, means no invoice for 45 days. These thresholds are fixed.
- Sales with no stock item on the bill count in total sales and profit, and appear as No item on the bill in the category and product figures.
Change what a screen shows
On Sales, Money and Stock, press Customise at the top right.
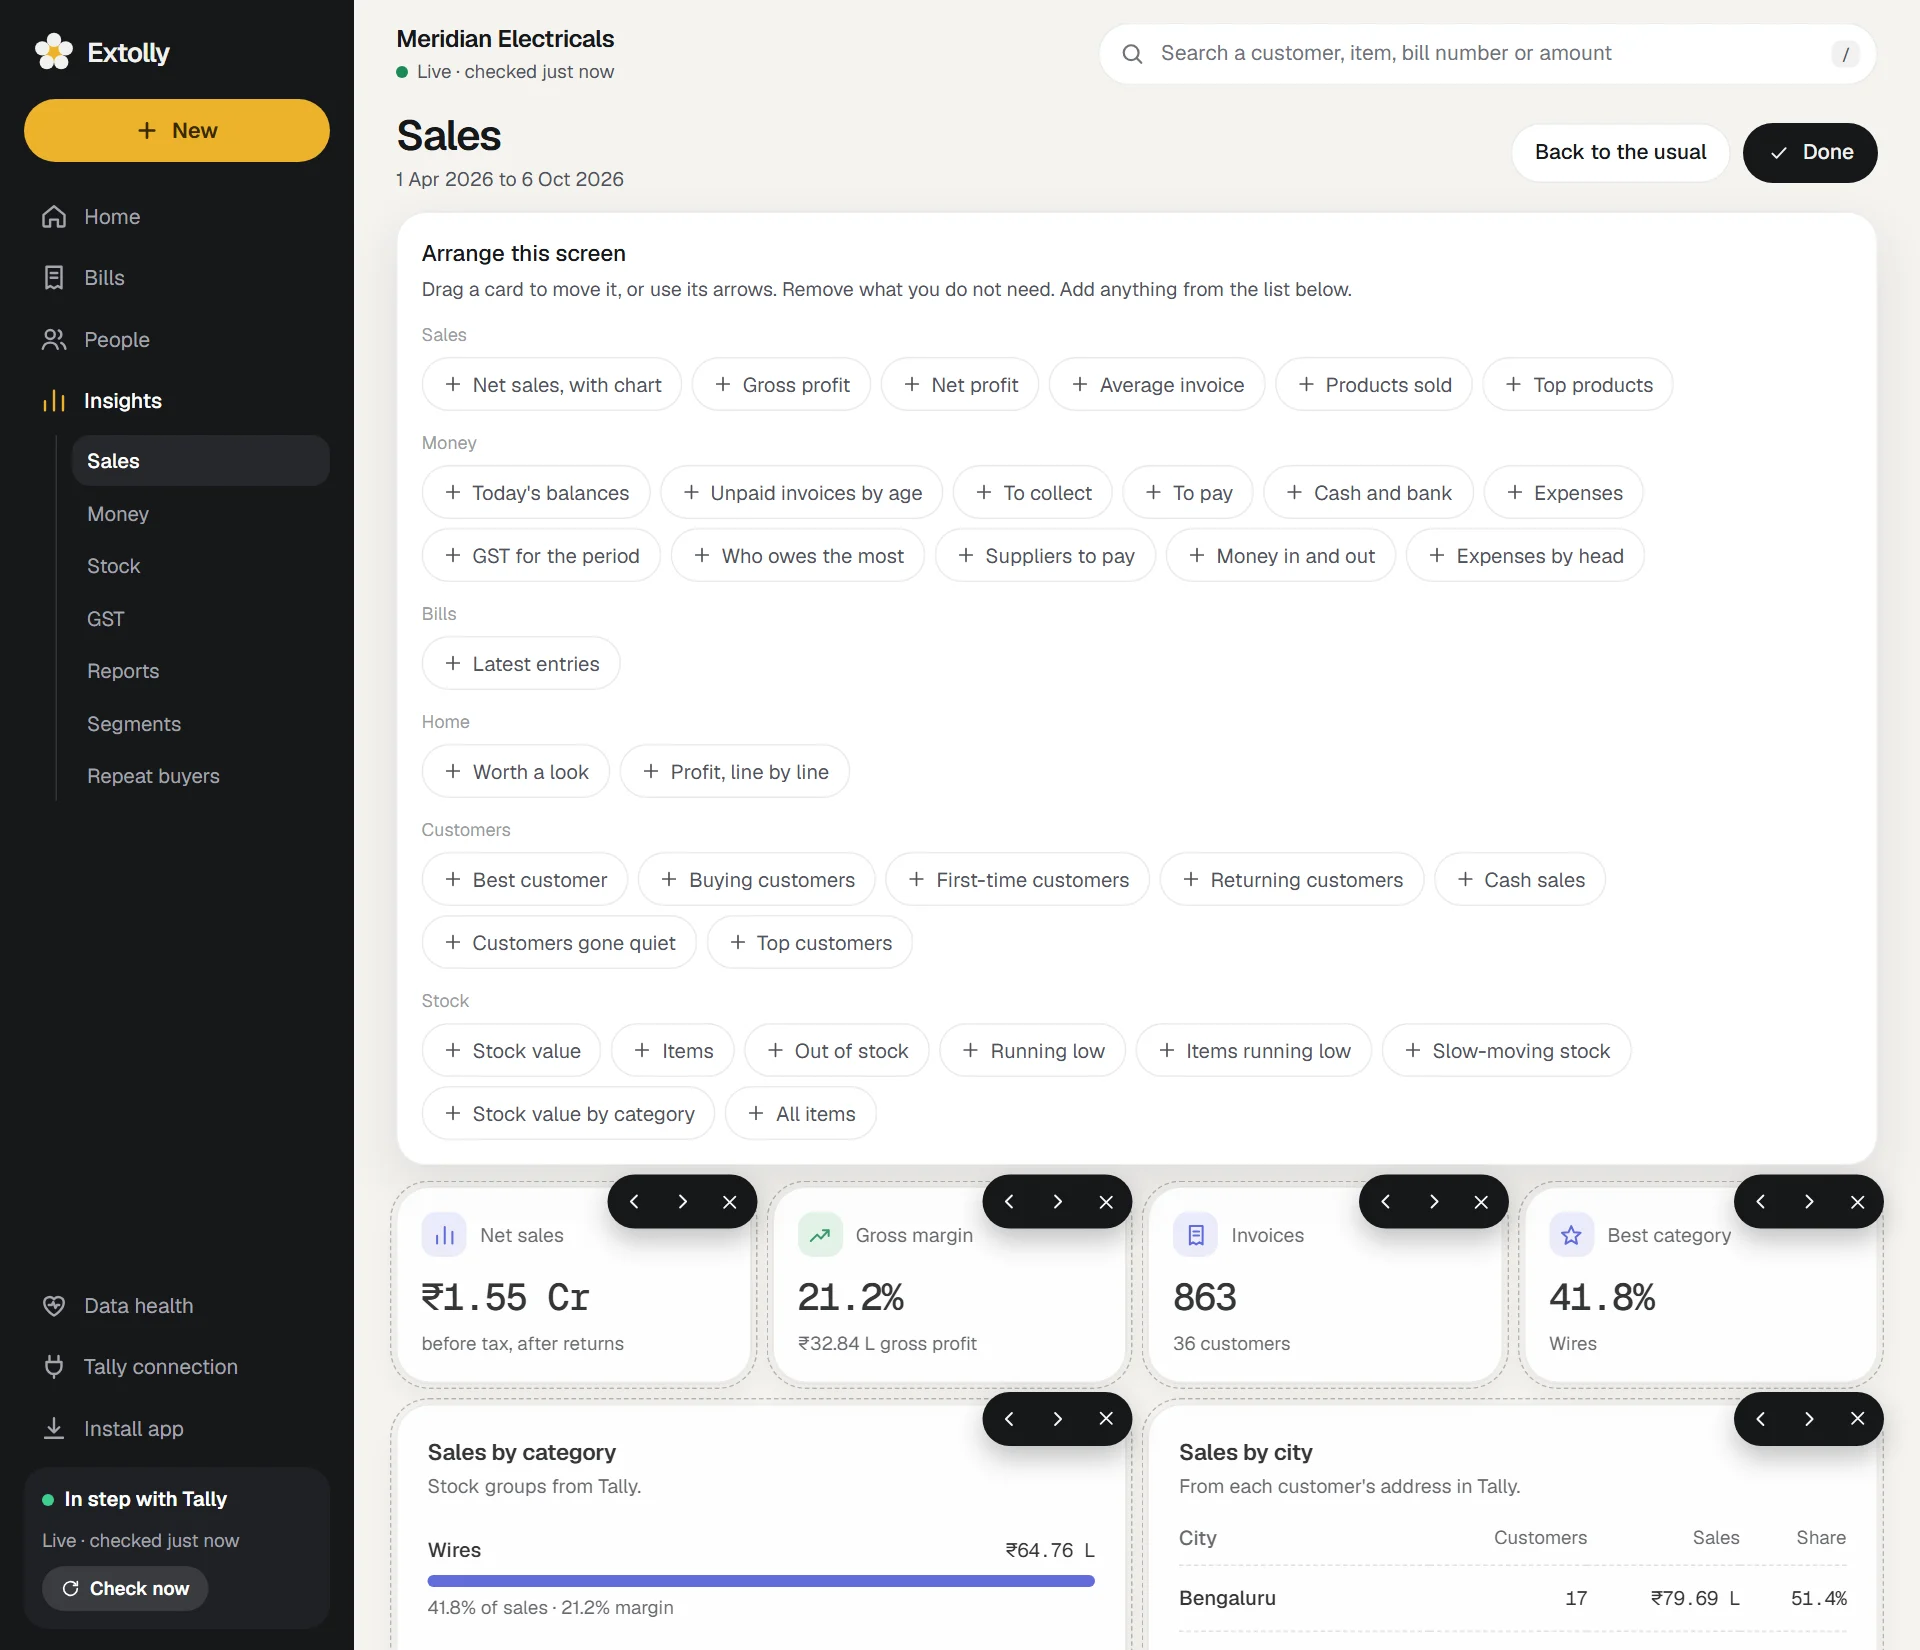
- Move a card by dragging it onto another, or with the arrows on the card.
- Remove a card with the x on it.
- Add a card by pressing its name in the list, which is grouped under Sales, Money, Bills, Home, Customers and Stock. Any card can go on any of the three screens.
- Press Done. Every change is saved as you make it.
Back to the usual restores the default cards.
More cards you can add include Net sales, with chart, Net profit, Average invoice, Expenses by head, Profit, line by line, Top customers, Customers gone quiet, First-time customers and Cash sales.
Download the figures
The cards themselves do not download. To get any of these figures into a spreadsheet, build a report: see Reports.
Still stuck? Write to support@extolly.com and say which step you are on.